
Syed Anas Hussain
June 12, 2026 • Updated June 15, 2026
15 mins Read
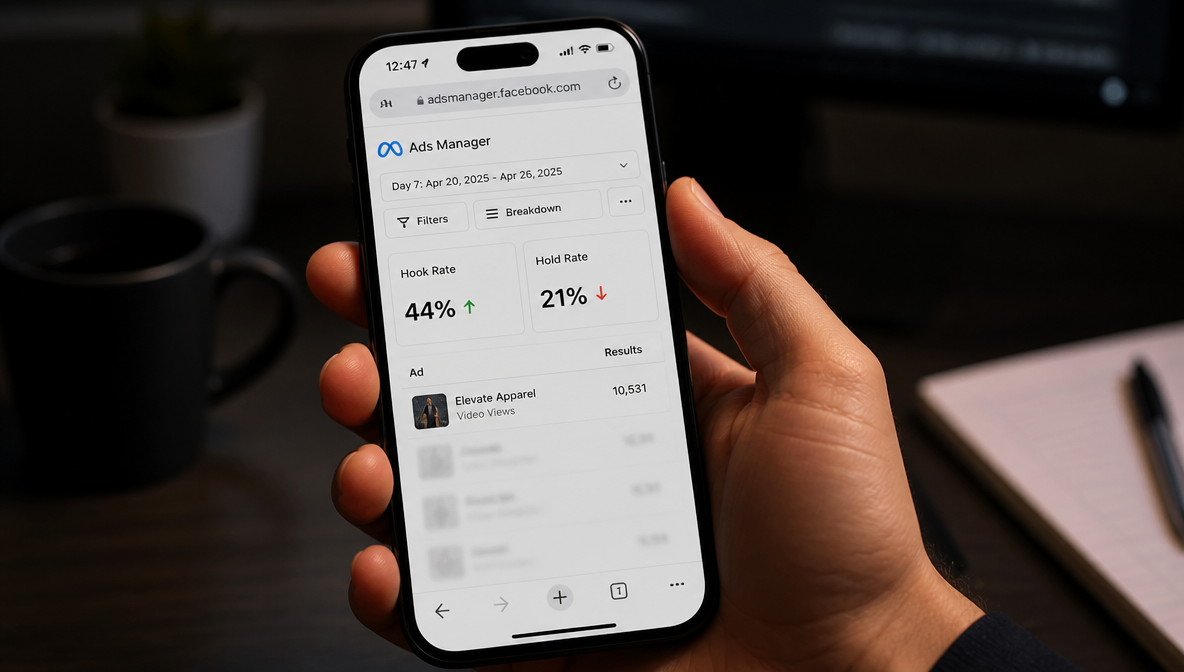
I was looking at a campaign with a 17% hook rate and I knew something was wrong — I just didn't know what. The ad looked great. The offer was strong. The targeting was dialed in. But nobody was watching past the opening. Hook rate is the metric that tells you the rest of your ad is invisible, and understanding it properly is the difference between throwing money at creative revisions and actually knowing what to fix.
Quick Answer: Hook rate is the percentage of viewers who watch past the opening threshold of your video ad — 3 seconds on Meta, 2 seconds on TikTok. On YouTube, the relevant metric is View Rate (watched past 30 seconds), not hook rate, because skippable ads can't be skipped until second 5. A good hook rate on Meta in 2026 is 28–30% (median) and 40%+ for top performers. If yours is below 20%, your hook — not your offer, not your targeting — is what's failing.
What Is Hook Rate? (The Metric That Decides Whether Your Ad Gets Seen)
Hook rate is the percentage of people who watch past the opening threshold of your video ad after it appears in their feed. What that threshold is depends on the platform:
- Meta (Facebook/Instagram): 3 seconds
- TikTok: 2 seconds
- YouTube: Hook rate doesn't apply — skippable pre-roll ads can't be skipped for the first 5 seconds, so the opening threshold isn't a viewer's choice. The relevant metric on YouTube is View Rate (watched past 30 seconds).
The formula for Meta and TikTok:
(threshold video views ÷ total impressions) × 100 = hook rate %
That number tells you one thing: did your opening stop the scroll? The threshold matters because it's the point at which a viewer has made a conscious decision to watch rather than pass. Before it, the scroll reflex is still active. After it, you have their attention — at least momentarily.
Why does this matter so much? Because every element of a well-crafted ad — the offer, the social proof, the CTA, the testimonial, the product demo — exists after the threshold. If your hook rate is 18%, 82% of your audience never sees any of it. You could have the best offer in your category and no one would know.
Hook rate is what strong ad creative lives or dies on before anything else. It's the gate. Pass it and your creative has a chance to do its job. Fail it and the rest is irrelevant.
How to Calculate Your Hook Rate
Where to find the data:
In Meta Ads Manager: Customize Columns → Video Engagement → "3-Second Video Views." This is the raw number you need. Your impressions are already visible in the standard view.
In TikTok Ads Manager: look for "2-Second Video Views" — TikTok uses a 2-second threshold rather than 3. This makes TikTok hook rates naturally higher than Meta's on the same creative, so don't compare across platforms directly.
In YouTube Ads: the equivalent is "5-second view rate" for skippable ads, which serves a different purpose and isn't typically benchmarked alongside Meta/TikTok hook rates.
The right metric on YouTube is View Rate: the percentage of viewers who watched past 30 seconds of the ad (or the full ad if it's under 30 seconds). This is what YouTube counts as a "view" and what Google Ads reports as your primary engagement signal. A solid View Rate on YouTube is 20–30%; strong is 30–40%; elite is 40%+. The goal on YouTube is not to stop a scroll — it's to survive the skip decision at second 5 and earn continued watching through to 30 seconds.
A worked example:
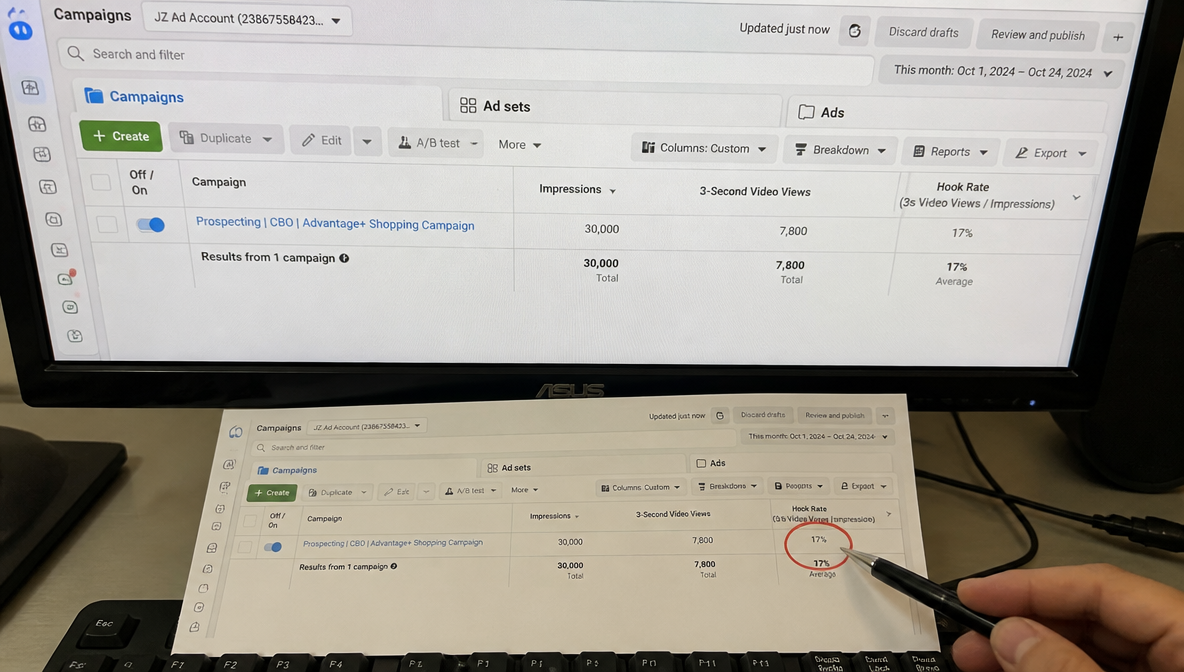
Your ad received 30,000 impressions in the last 7 days. Your 3-second video views were 7,800.
7,800 ÷ 30,000 = 0.26 × 100 = 26% hook rate
Slightly below the current median but not broken. It tells you the hook is working for roughly 1 in 4 viewers — and there's meaningful room to improve without scrapping the entire creative.
Hook Rate Benchmarks in 2026 (Meta, TikTok, YouTube)
| Platform | Below Average | Solid | Strong | Elite (Top 10%) |
|---|---|---|---|---|
| Meta (Facebook/Instagram) | Under 20% | 20–28% | 28–40% | 40%+ |
| TikTok | Under 25% | 25–33% | 33–45% | 45%+ |
| YouTube (skippable) | Under 15% | 15–22% | 22–35% | 35%+ |
An important nuance most benchmark articles skip: a high hook rate doesn't mean a converting ad. I've run campaigns with 43% hook rates and mediocre ROAS. The hook stopped the scroll — the ad was entertaining — but it didn't qualify the right viewer or set up the offer. Hook rate tells you people paused. It doesn't tell you they cared about what followed.
Always pair hook rate with hold rate and click-through rate. High hook rate + high hold rate + strong CTR is what separates performing creatives from merely watchable ones.
Ad Hook Rate Benchmarks by Industry and Category
Hook rate benchmarks vary significantly by industry. The platform benchmarks above are blended averages across all categories — but a 28% hook rate that's solid for a DTC apparel brand is underperforming for a beauty brand running UGC. Use the table below to calibrate your targets against your specific category, then build your own account baseline from there.
| Industry / Category | Typical Hook Rate Range (Meta) | Strong Performance | Notes |
|---|---|---|---|
| Beauty & Health / Wellness | 30–42% | 42%+ | Highest natural hook rates in paid social. UGC-style and before/after hooks outperform polished brand video in almost every test. Visual transformation in the first frame is the primary driver. |
| Ecommerce / DTC (general) | 25–35% | 35%+ | Broad range because DTC covers very different product types. Impulse-buy products (accessories, home goods) trend higher. Considered purchases (furniture, electronics) trend lower. Product-in-use in the first frame consistently outperforms static product shots. |
| Apparel & Fashion | 22–32% | 32%+ | Motion and styling context in the first frame drive the best hook rates. Flat product shots on white backgrounds underperform significantly. UGC styling videos and fit reveals trend toward the top of the range. |
| Food & Beverage | 28–40% | 40%+ | Food content has among the highest natural scroll-stop rates across categories. Satisfying preparation shots, texture reveals, and pours in the first 2 seconds are the highest-performing hook formats in this category. |
| SaaS / B2B | 14–22% | 22%+ | Lowest hook rates in paid social — audiences are smaller, more selective, and scrolling with professional intent rather than entertainment intent. Hook rate matters less than relevance signal here: a 16% hook rate with strong downstream CTR and lead quality often outperforms a 28% hook with unqualified viewers. For enterprise-scale B2B creative production, ImagineArt Enterprise handles brand-governed ad creative generation at volume. |
| Home & Living / Furniture | 18–28% | 28%+ | High consideration, longer purchase cycle. Hook rates trend lower than impulse categories. Aspirational lifestyle context in the first frame (room setting rather than isolated product) performs better than product-only openings. |
| Pet Care | 30–40% | 40%+ | Pet content has inherently high scroll-stop value. Actual animals in the first frame is the obvious and correct hook format. Performs similarly to beauty in terms of UGC vs. polished brand video — UGC-style pet owner testimonials consistently outperform brand-produced content. |
| Finance / Insurance | 15–25% | 25%+ | Low natural engagement category. Fear-based and result-based hooks ("What happens to your family if...") outperform generic financial imagery. Regulated categories should prioritise compliance review alongside hook testing. |
How to use this table: Find your category, then compare your current hook rate against the "strong performance" threshold. If you're below the typical range, the hook format is the first thing to address. If you're within the typical range but below strong performance, creative volume testing (more hook variations, not a complete creative overhaul) is usually the most efficient path to improvement. For teams generating high-volume creative variants at the enterprise level, the category benchmarks above are the targets worth building your testing cadence around.
Hook Rate and CPM: The Relationship Most Advertisers Miss
Hook rate doesn't just measure creative performance — it directly influences what you pay for distribution.
Meta's ad auction doesn't price purely on bid. It evaluates three things: your bid, your estimated action rates, and the ad's value to the user. Hook rate feeds directly into the third signal. When your ad earns high early attention — viewers staying past three seconds at above-average rates — the algorithm reads this as a relevance signal and rewards it with better delivery efficiency. The practical outcome: lower effective CPM over time on creatives with strong hook rates.
The inverse is equally true and more immediately painful. A low hook rate — particularly when combined with low hold rate and low CTR — signals below-average quality to the algorithm. Meta responds by restricting delivery or requiring higher bids to maintain the same impression volume. You pay more per impression for a creative the audience is actively avoiding.
The mechanism is Meta's Andromeda system, which tests creatives in micro-batches and uses early attention signals to determine which ads deserve aggressive distribution. Ads that hook viewers early get tested more broadly. Ads that don't receive less delivery regardless of bid, because the system has already flagged them as low-attention.
The CPM impact in practical terms:
| Hook Rate Range | Typical CPM Effect | What It Means |
|---|---|---|
| Below 15% | CPM elevated, delivery restricted | Algorithm is limiting spend on a low-attention creative. Fixing the hook is the priority before any other optimisation. |
| 15–25% | CPM at or above account average | Delivery is running but the creative isn't earning algorithmic favour. Hook improvement has the most direct CPM impact here. |
| 25–40% | CPM at or below account average | Creative is earning attention efficiently. Focus shifts to hold rate and CTR for downstream optimisation. |
| 40%+ | CPM meaningfully below account average | Algorithm is actively rewarding the creative with efficient distribution. Scale carefully to avoid exhausting the audience that's responding. |
This is why hook rate is the first metric to check when CPM spikes on a previously performing creative. The creative hasn't changed — but if the audience has seen the same opening enough times that the scroll reflex is overriding the stop-and-watch response, hook rate will drop before CPM climbs. Catching it at the hook rate stage is cheaper than waiting for the CPM signal.
The fix at that point is a new hook, not a new campaign. Same offer, same body, same CTA — just a different opening three seconds. This is the ad fatigue pattern that kills otherwise strong creatives: the body is still working, the audience is still convertible, but the hook has been seen too many times to earn the first three seconds anymore.
Hook Rate vs. Hold Rate — Which One Actually Predicts Winners?
Hook rate = percentage of viewers who make it past the first 3 seconds. Measures the opening.
Hold rate = percentage of the total video length that viewers watch on average. Measures the middle.
A creative with 40% hook rate and 25% hold rate means your opening is working but you're losing people in the middle — probably a pacing problem.
A creative with 20% hook rate and 70% hold rate means almost nobody stops, but the few who do are watching most of it — strong substance, weak opening.
The combination you're aiming for: hook rate above your platform benchmark, hold rate above 40% for videos under 30 seconds. That combination is the profile of a ROAS driver. To learn more review our blog on Hook Rate vs Hold Rate.
Why Your Hook Rate Is Low (Five Reasons Worth Knowing)
1. You're opening with your brand or product name.
No viewer on a social feed is waiting for your logo. Branding in the first 3 seconds signals "this is an ad" at exactly the moment you need to signal "this is interesting." Push branding to the 5–10 second mark.
2. Your first frame looks like every other ad.
Generic lifestyle stock footage, flat-lay product shots on white backgrounds, talking heads opening with "Hi, I'm [name]" — the scroll reflex overrides everything familiar. Pattern interrupt is the mechanism that makes someone's thumb stop.
3. Your creative depends on audio.
The majority of social feed videos are watched without sound. If your hook only works with audio on, you've lost the muted-feed audience before the three-second clock starts. Put your hook in the visual, not the audio.
4. Your hook doesn't signal the right audience quickly enough.
A hook that clearly signals a specific audience ("specifically for Shopify stores doing over $50k/month") will have a lower overall hook rate but better downstream metrics. The best hooks self-select — they're slightly polarizing, not broadly appealing.
5. You're building up to the hook instead of leading with it.
Your most compelling element — the result, the claim, the surprising statistic, the before-after — belongs in the first 3 seconds. Slow-burn storytelling doesn't work in paid social. Front-load everything.
When hook rate drops suddenly on a previously performing creative, that's usually ad fatigue — the audience has seen the same opening enough times that the scroll reflex overrides the stop-and-watch response. The fix is a new hook, not a tweak.
How to Test 5 Hook Variations in One Afternoon
Here's the thing nobody says plainly: a low hook rate is not a creative insight problem. It's a creative volume problem.
Most advertisers test one hook at a time because producing each version takes days and costs real money. You write a hook idea, brief an editor or an agency, wait three to five business days, review, revise, launch. By the time you have data on one hook variation, you could have had a week of results from five.
Top-performing brands on Meta are testing 20 to 50 creatives every month. Not because they have bigger teams — because they've removed production overhead from the testing equation. If you want to compare the tools available for this kind of rapid creative production, best ad creative AI tools covers the current landscape in depth.
For hook testing specifically, this is what AI Ad Studio is built for. The workflow:
Step 1 — Drop in your product.
Paste your product URL and AI Ad Studio pulls the product details automatically. Or upload images and copy manually.
Step 2 — Choose your ad type.
Video ad, static creative — pick the format you're testing hooks for.
Step 3 — Write your 5 hook variations.
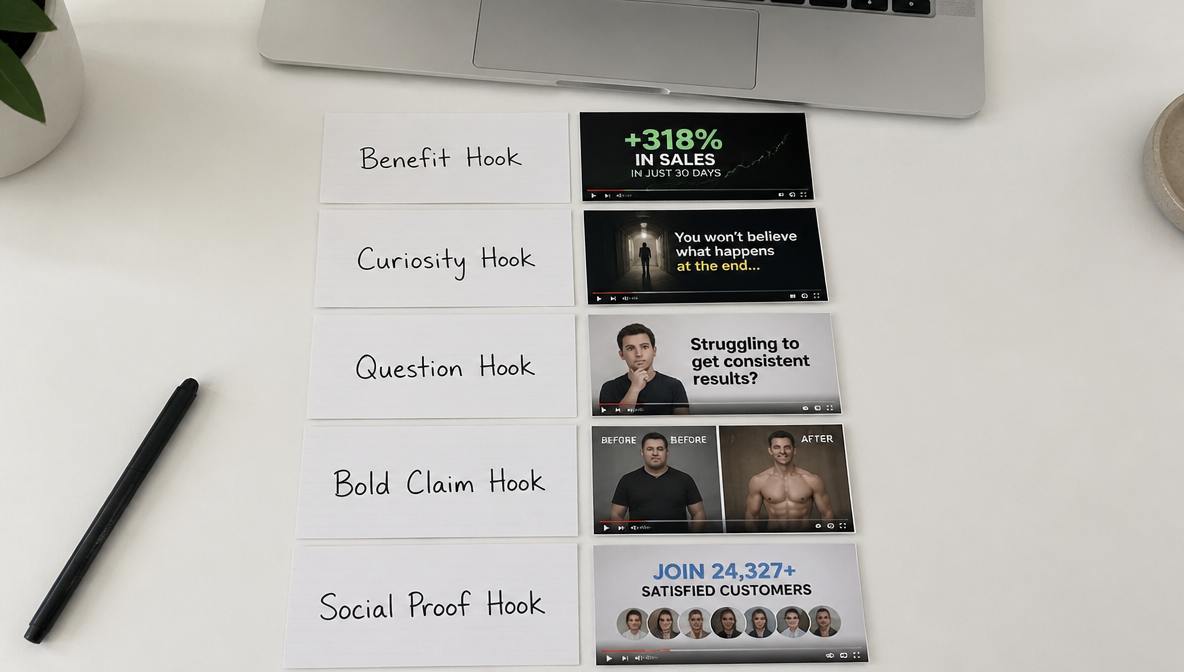
Five hook types worth testing on any product:
- Benefit hook — Lead with the outcome. "Lost 12 pounds in 30 days without changing what I eat."
- Curiosity hook — Create an open loop. "Here's why every DTC brand I talk to is switching to this."
- Question hook — Ask what your audience is already silently asking. "Why does your CPM keep going up even though nothing changed?"
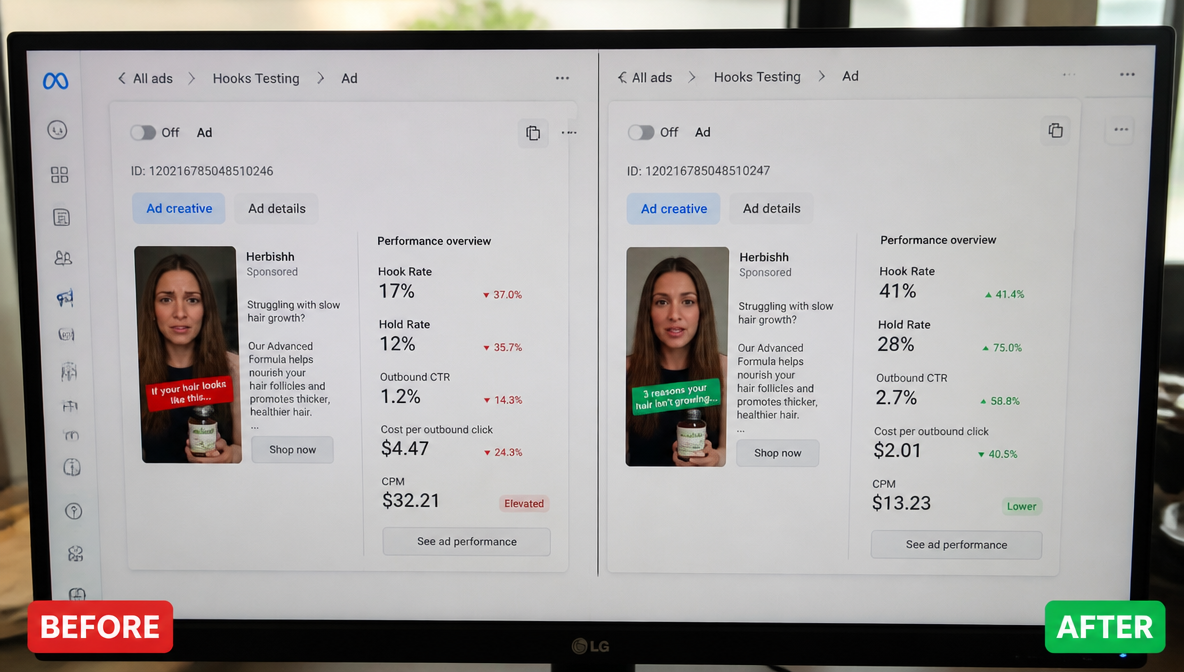
- Bold claim hook — Make a specific, provable statement. "This one change took our hook rate from 19% to 41% in seven days."
- Social proof hook — Lead with a result. "32,000 stores now use this to generate their ads. Here's what changed."
Step 4 — Add your script or prompt.
Paste the same body copy for each variation — keep everything identical except the hook. You're isolating the variable.
Step 5 — Generate.
AI Ad Studio produces a production-ready ad for each hook. Not a mockup. Something you can launch directly.
Step 6 — Launch all five.
Run them simultaneously with equal budget. Equal impressions, equal audience. This is proper ad creative testing — variable isolation, not gut feeling.
In 48 to 72 hours you have real hook rate data across five variations. The winner becomes your control. The four losers give you signal on what your specific audience doesn't respond to. You've learned more in three days than most teams learn in a month of single-variation testing.
When the data comes in, ad creative analysis covers how to read the numbers and make the right call on what to scale.
What to Do When Your Hook Rate Improves But Conversions Don't
If your hook rate has climbed to 35%+ but CPA hasn't moved, the problem has migrated downstream. This is the decoupled hook rate problem.
Check your hold rate. If people stop at the hook but leave at 8 seconds, the transition from the opening to the offer isn't earning continued attention. The hook has created an expectation that the rest of the ad isn't delivering.
Check your click-through rate. High hook rate and high hold rate with low CTR usually means the CTA isn't clear, urgent, or matched to the viewer's intent level. The creative performed; the conversion mechanism didn't.
Check the landing page. The AI Image Generator can handle your ad visuals at scale, but if the landing page experience drops below the quality of the ad, the conversion chain breaks there. Hook rate is the start of a chain, not the whole chain.
The metric that tells you where the problem lives: drop-off rate by second. Front-heavy loss (3–5 seconds) = hook promised something the next beat doesn't deliver. Mid-heavy loss (10–15 seconds) = story structure isn't holding. Back-heavy loss (20–25 seconds in a 30-second ad) = offer and CTA are the weak points.
Fix the right section, not the whole thing.
FAQs
Hook rate is the percentage of viewers who watch past the first three seconds of a video ad after it appears in their feed. Formula: (3-second video views ÷ total impressions) × 100. It measures whether your opening was compelling enough to stop the scroll — and is a leading indicator for whether the rest of your ad will ever be seen.
On Meta, the median hook rate in 2026 is around 28%. A rate of 28–40% is solid performance; 40%+ puts you in the top 10% of advertisers. Below 20% indicates the hook is failing to stop the scroll and should be the first thing addressed before testing any other creative variable.
Divide your 3-second video views by your total impressions, then multiply by 100. Example: 8,400 three-second views ÷ 30,000 impressions = 28% hook rate. In Meta Ads Manager, find 3-second video views by customizing your columns under Video Engagement.
Hook rate measures whether viewers pass the first 3 seconds — it tells you if the opening stopped the scroll. Hold rate measures what percentage of the full video length viewers watch on average — it tells you if the content sustained their attention. You need both to be high for a creative to drive results: hook rate gets them in, hold rate keeps them watching.
The five most common causes: opening with branding or a logo that signals 'this is an ad', generic first frame that blends with every other creative, audio-dependent hook that doesn't work on a muted feed, a hook that doesn't quickly signal the right audience, or slow-burn storytelling that builds to the compelling element instead of leading with it.
Test at least 3 to 5 hook variations simultaneously with equal budget, keeping every other variable identical. This isolates the hook as the variable and gives clean data. Top-performing brands on Meta are running 20 to 50 creative tests per month. AI-generated ads make this volume achievable without a large production team.
Five hook types that consistently perform: benefit hook (lead with the result), curiosity hook (create an open loop), question hook (ask what your audience is already silently asking), bold claim hook (make a specific provable statement), and social proof hook (open with a result or number). Test each type against your audience — the winner varies by product category and audience familiarity with the brand.
Syed Anas Hussain
Syed Anas Hussain is a computer scientist blending technical knowledge with marketing expertise and a growing passion for AI innovation. Curious by nature, he dives into new AI sciences and emerging trends to produce thoughtful, research-led content. At ImagineArt, he helps audiences make sense of AI and unlock its value through clear, practical storytelling.