
Syed Anas Hussain
April 20, 2026 • Updated June 10, 2026
10 mins Read
Most marketers look at the wrong metrics. Or they look at the right ones too late. By the time CPA doubles and ROAS tanks, the damage is already done. Ad creative analysis is not about pulling a report after a campaign ends. It is about reading what your data is telling you at every stage — and acting before performance collapses.
How to Do Ad Creative Analysis
You do an ad creative analysis by tracking three funnel stages — attention, engagement, and action — using specific metrics at each stage to diagnose exactly where a creative is winning or losing. You then use those signals to decide whether to refresh, iterate, or replace.
That is the short answer. But if you really want to understand how to do ad creative analysis properly — which metrics matter, how to read them by platform, and how to know when a creative has stopped working — this article covers all of it.
What Is Ad Creative Analysis?
Ad creative analysis is how you evaluate whether a specific ad's hook, visual, copy, and format are actually doing their job.
It is different from campaign reporting. Campaign reporting tells you how your budget is being spent. Creative analysis tells you why performance looks the way it does — and which element of the creative is responsible.
The key question creative analysis answers is: where in the journey is this ad losing people?
The 3-Stage Creative Analysis Framework
Every ad moves a viewer through three stages. Each stage has its own metrics. Each metric tells you something different.
| Stage | Question | Key Metrics |
|---|---|---|
| Attention | Did it stop the scroll? | Hook rate, thumb-stop rate, CPM |
| Engagement | Did it hold attention? | Hold rate, watch time, engagement rate |
| Action | Did it convert? | CTR, CPA, ROAS |
Analyse all three. An ad that fails at Stage 1 has a hook problem. An ad that passes Stage 1 but fails Stage 2 has a story problem. An ad that converts at Stage 2 but not Stage 3 has an offer or CTA problem. Each diagnosis leads to a different fix.
Stage 1 — Attention: Did Your Creative Stop the Scroll?
Hook Rate (3-second view rate)
This is your first data point on every video ad. It tells you what percentage of people who saw the ad watched at least 3 seconds.
- Target: 30% to 40%
- Flag: below 25%
If your hook rate is low, the problem is in the first 3 seconds. Not the offer. Not the CTA. The opening frame is not compelling enough to stop a thumb mid-scroll. Fix the opening before changing anything else.
CPM (Cost Per 1,000 Impressions)
A rising CPM without any budget change means the algorithm is paying more to show your ad because engagement signals have weakened. Think of it as your early warning system. When CPM spikes, refresh the creative — not the bid.
Stage 2 — Engagement: Did Your Creative Hold Attention?
Hold Rate and Average Watch Time
Hook rate tells you if people stopped. Hold rate tells you if they stayed.
- Target hold rate: 25%+
- Target average watch time: at least 50% of video duration
If your hook rate is strong but hold rate is weak, the opening worked but the body of the ad is losing people. Look at your story arc. Is there a clear value prop? Does the pace drag? Is the proof point landing too late?
Engagement Rate
Likes, comments, shares, and saves as a proportion of impressions. Strong engagement with poor conversion usually means the creative is interesting but the offer is not compelling enough to act on.
Stage 3 — Action: Did Your Creative Convert?
CTR (Click-Through Rate)
Platform benchmarks to work with:
| Platform | Target CTR |
|---|---|
| Meta | 1.5%+ |
| TikTok | 0.8% to 1.0%+ |
| 0.4% to 0.6%+ | |
| YouTube | Varies by format |
High CTR with poor conversion means the ad is generating interest but the landing page or offer is breaking the journey. That is not a creative problem — it is a post-click problem. Do not kill the creative.
CPA and ROAS
These are your bottom-line creative metrics. An ad with 500K impressions and 15K likes but a CPA of $847 is not performing — no matter how good the engagement looks.
Track CPA and ROAS against your account baselines, not industry averages. Your numbers depend on your product, margin, and funnel.
How to Measure Social Ad Creative Performance by Platform
The same creative can perform differently across platforms. Benchmarks vary. Fatigue timelines vary. Here is what to watch on each.
Meta and Instagram
- Primary metrics: hook rate, CTR, CPA, frequency
- Refresh cadence: every 2 to 4 weeks
- Fatigue trigger: frequency crossing 3.0 to 4.0
Meta rewards early engagement. If a creative gets strong signals in the first few days, the algorithm rewards it with cheaper delivery. If it does not, you pay more for worse results.
TikTok
- Primary metric: video completion rate
- TikTok prioritises full watches and surfaces high-completion content to more people
- Fatigue hits fast — refresh weekly on high-budget campaigns
- CTR benchmark: 0.8% to 1.0%+
On TikTok, your creative needs to feel native. Polished production ads consistently underperform UGC-style content here. If your completion rate is low, the creative looks like an ad — not content.
YouTube
- Primary metrics: view-through rate (VTR) and completion rate
- Skippable ads: target 15% to 30% VTR for short-form content
- Intent is higher here — viewers are actively seeking content, not passively scrolling
Strong YouTube creative earns attention differently. You have 5 seconds before the skip button appears. The first line of audio matters as much as the first visual.
- Primary metrics: CTR and engagement rate
- Audience is smaller and more specific
- Frequency caps matter more — fatigue comes faster with narrow B2B audiences
- CTR benchmark: 0.4% to 0.6%+
Recommended read: How to Use AI to Test Ad Creative Variations in 2026
How to Determine If an Ad Creative Is Not Working

This is the diagnostic half of creative analysis. Knowing the metrics is one thing. Knowing what they are telling you is another. Here are the five signals that tell you a creative has stopped working.
Signal 1 — CTR Drops 20% Below the 7-Day Baseline
Not a single bad day. A sustained pattern across 7 consecutive days. Compare week over week, not day over day. One bad day is noise. Seven bad days is a pattern.
Signal 2 — CPA Rises 15% to 20% Above Your 30-Day Median
Without any changes to budget or targeting. If CTR and CPA are both trending negative at the same time, do not wait — a refresh is urgent.
Signal 3 — Frequency Crosses 3.0 to 4.0
People who have seen your ad four or more times are actively training the algorithm to deprioritise it. They are not just ignoring it. They are signalling it is irrelevant. The algorithm responds by charging you more to show it.
Watch these thresholds by audience size:
| Audience Size | Refresh Trigger |
|---|---|
| Under 100K | Frequency hits 2.0 |
| 100K to 500K | Frequency hits 3.0 |
| 500K+ | Frequency hits 4.0 |
Signal 4 — Conversion Rate Drops While CTR Holds
This specific pattern is important to read correctly. The creative is still stopping the scroll — but something after the click is breaking. Check your landing page, your offer clarity, and your CTA message before killing the ad. This is a post-click problem, not a creative problem.
Signal 5 — Negative Sentiment in Comments
"Why do I keep seeing this?" in your comments section is an early warning before the metrics move. Comment sentiment often predicts performance decline by 3 to 5 days. Act on it early.
Refresh vs Retire: How to Decide
Not every underperforming creative needs to be scrapped. Decide based on how far performance has fallen.
Refresh when:
- Early fatigue signals are showing but CPA is still above your minimum acceptable threshold
- The core concept is strong but one element — hook, visual, or headline — is wearing out
- The ad has not been refreshed before
Retire when:
- CPA exceeds your target by 75% or more
- You already refreshed it once and performance is still declining
- The concept has been exhausted
Retired creatives are not dead. Revisit them with a different audience after 60 to 90 days. Sometimes a rested creative finds a new audience.
What to Do After Creative Analysis — Turning Data Into Better Ads
Analysis is only useful if it changes what you produce next. Here is how to close the loop.
Build a winners library.
Every time a creative outperforms your baseline, document it. Note which metric proved it, which element drove it, and what the campaign context was. Over time, this becomes your most valuable creative asset — a documented record of what actually works for your brand.
Feed winning signals back into your brief.
If hook rate was the winning variable, brief the next campaign with five different hook options. If a specific format outperformed on TikTok, brief that format as your starting point. Let the data write the brief.
Use ImagineArt AI Ad Studio to generate variations based on what analysis reveals.
Analysis tells you what to fix. Ad Studio let you fix it fast. Here is how to do it in three steps:
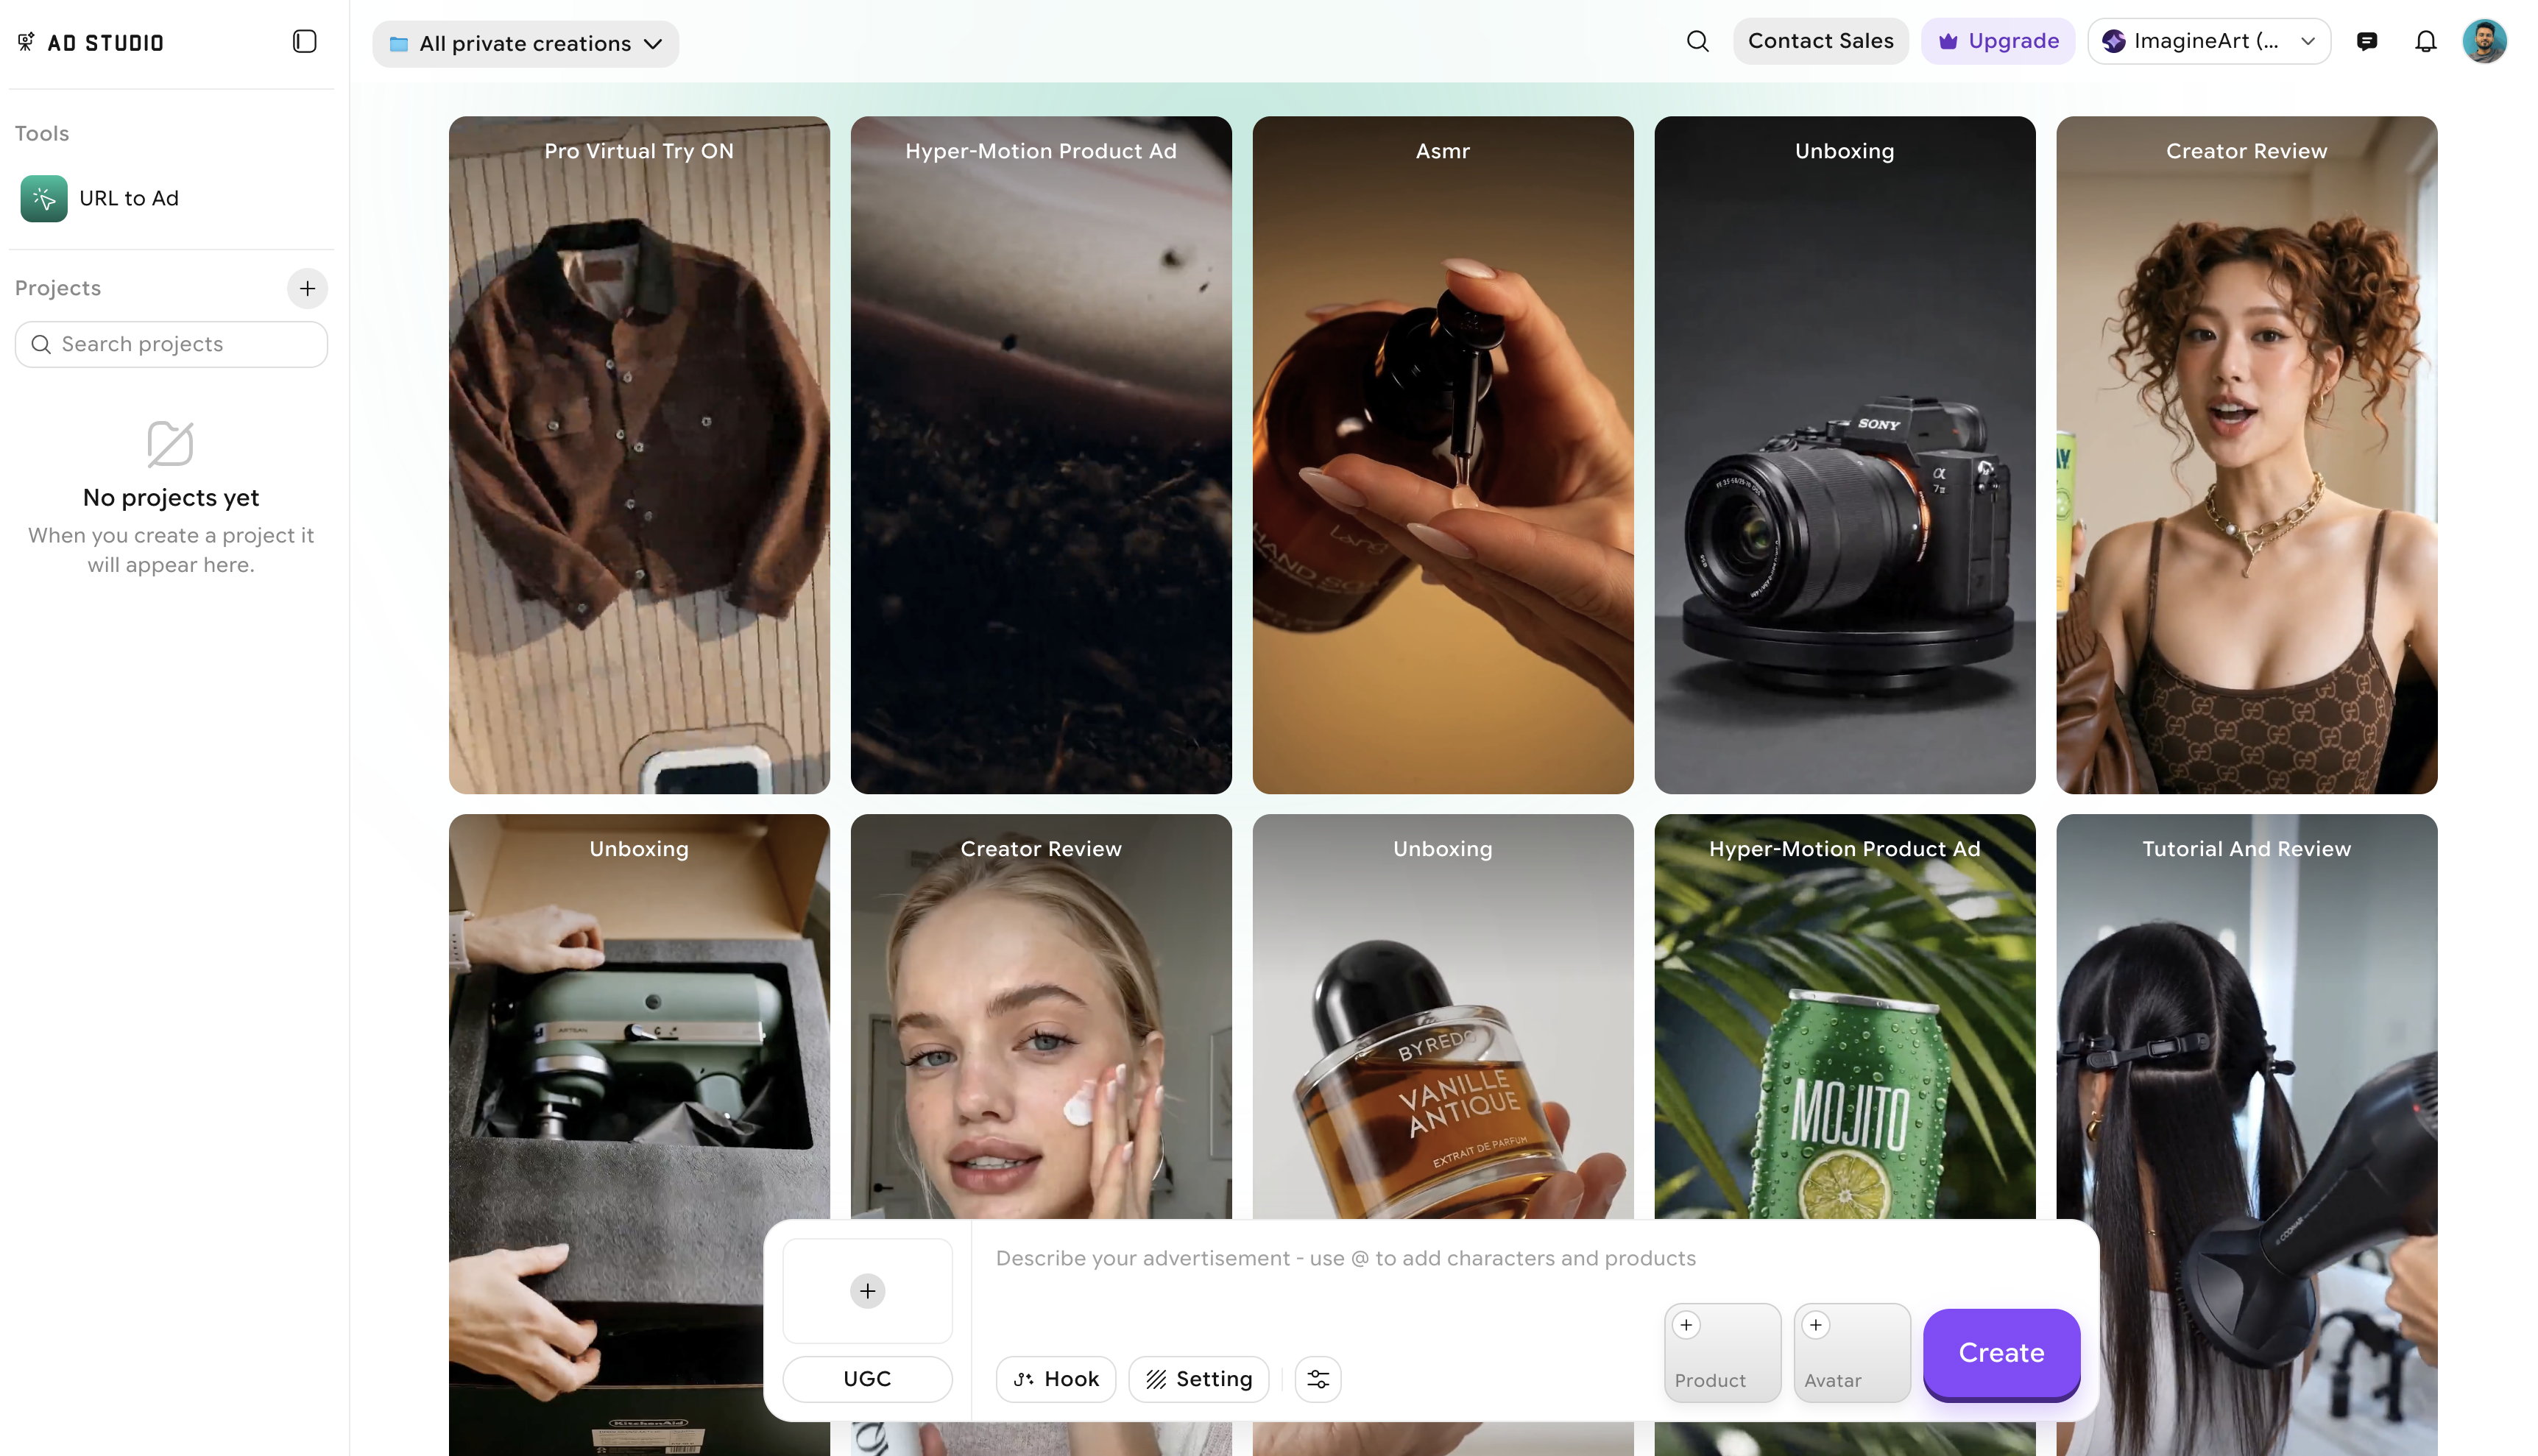
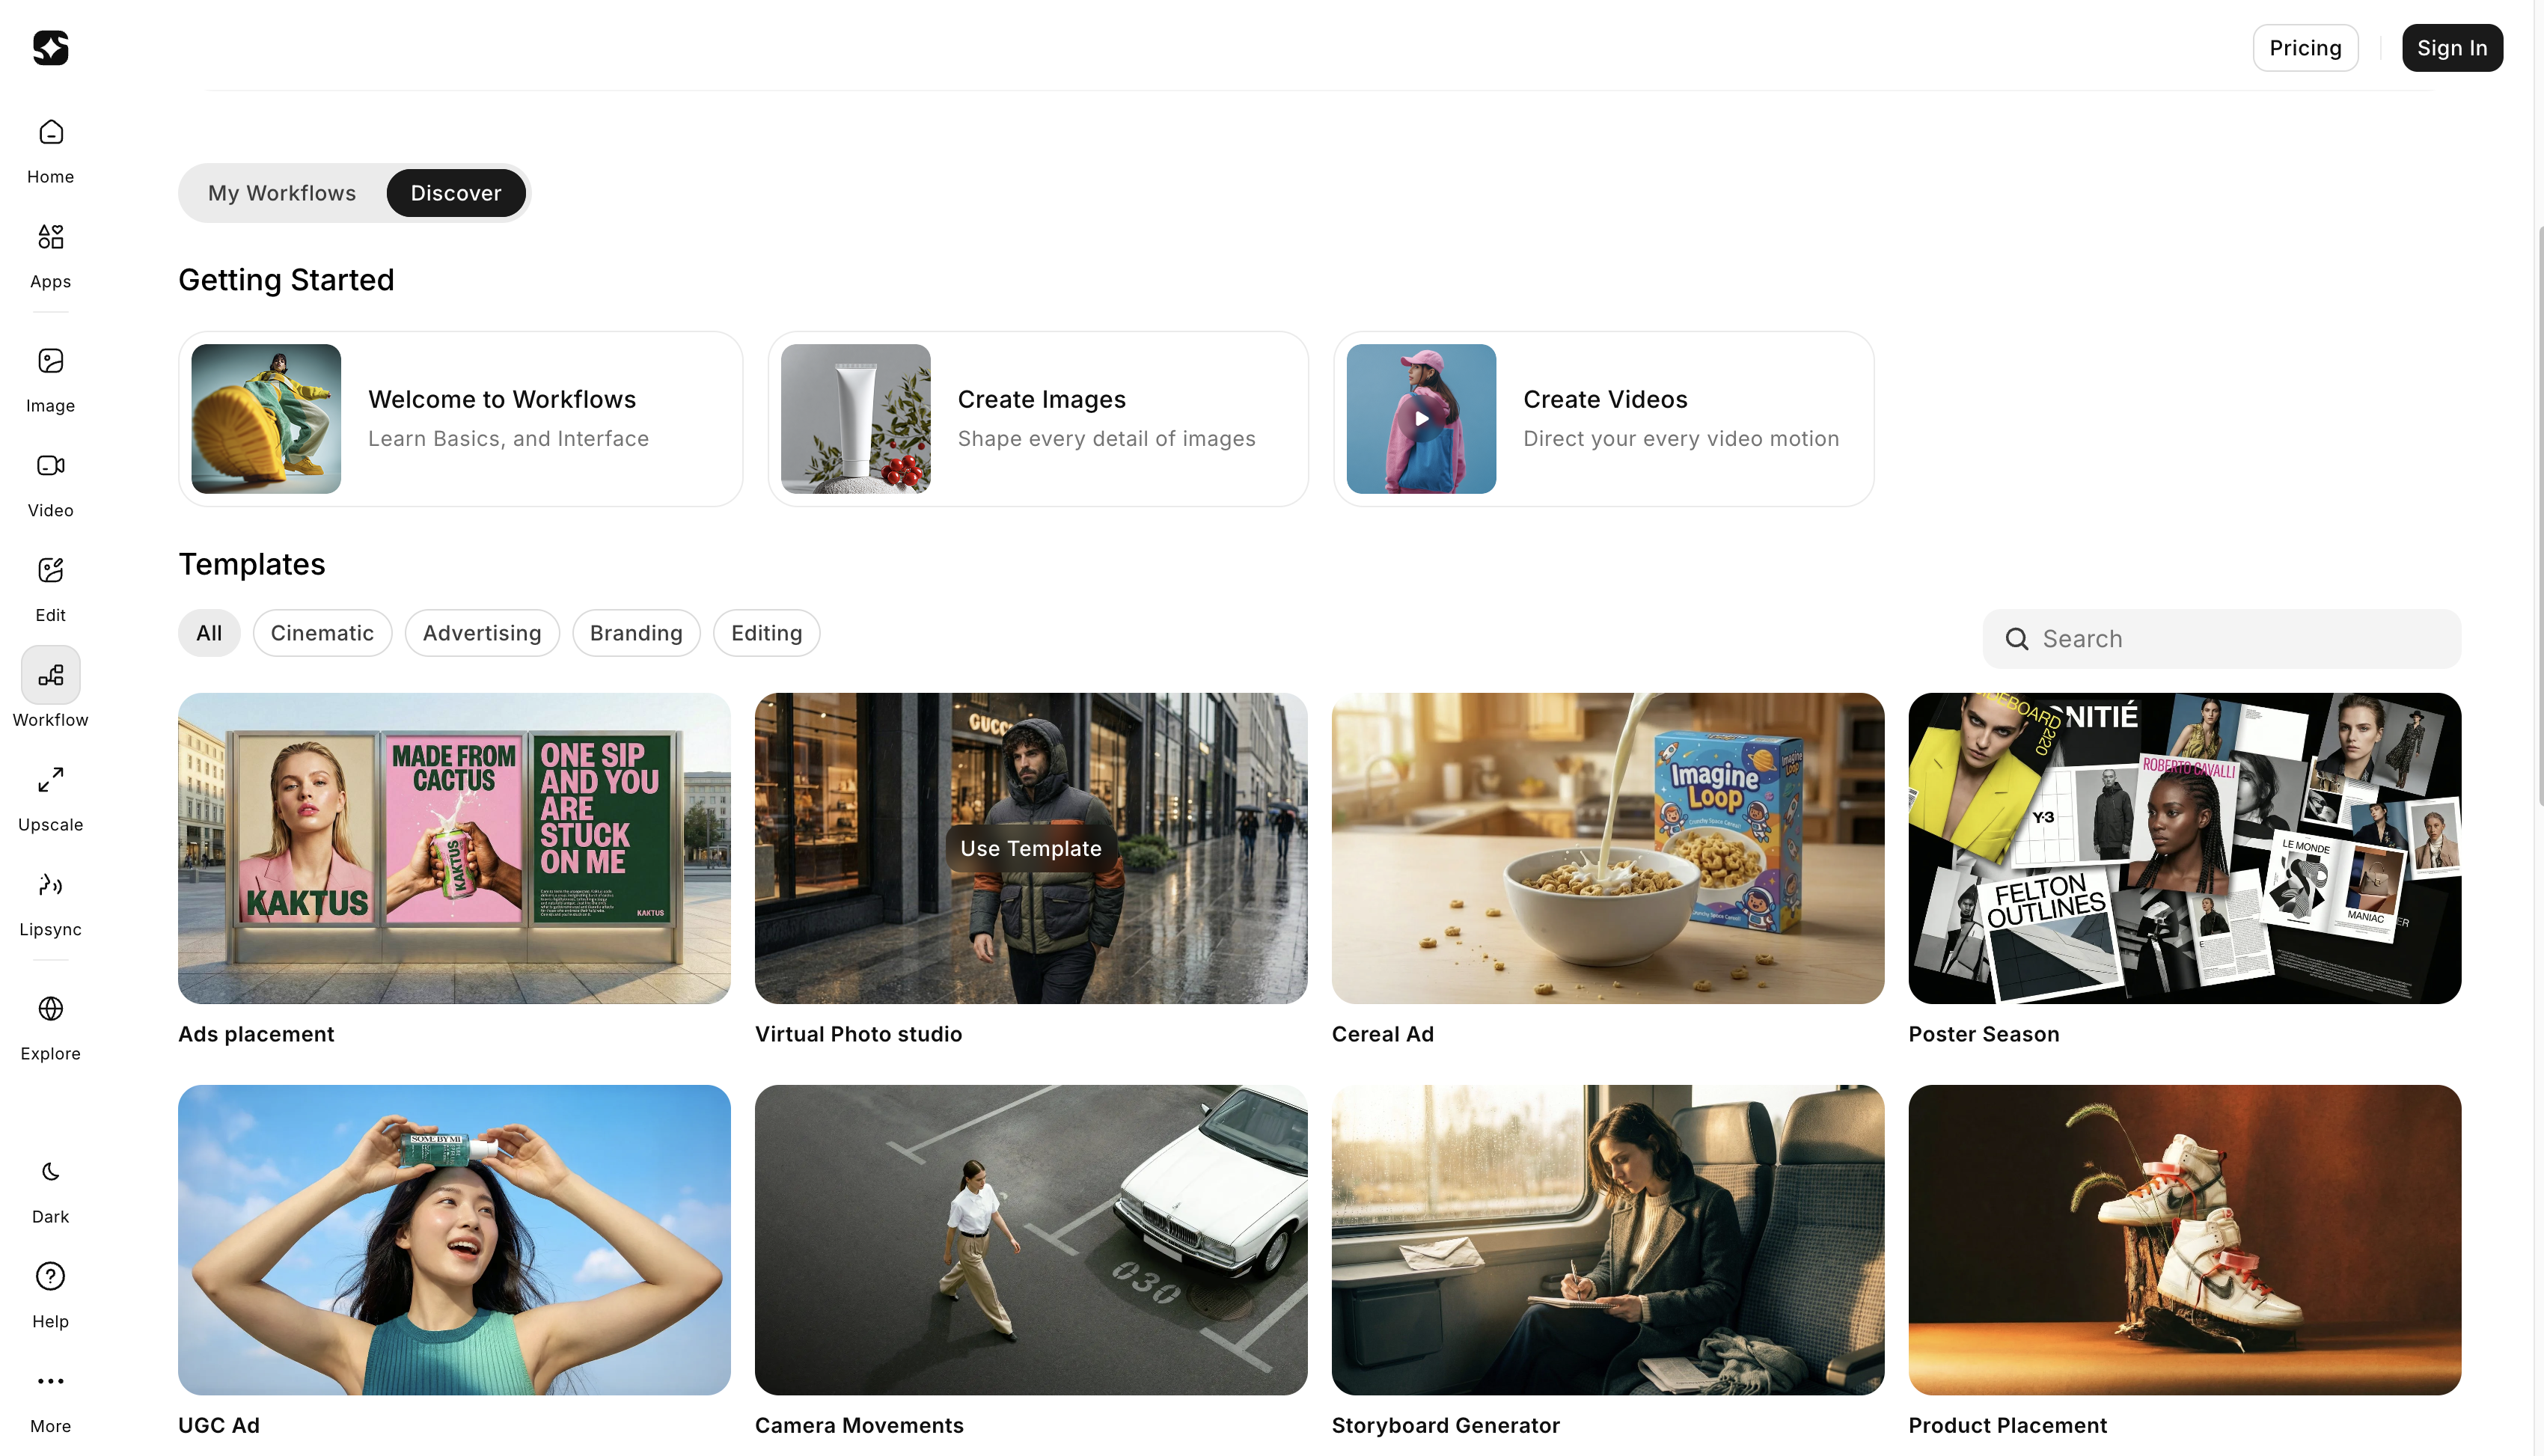
Step 1 — Start from your product URL and pick the right template. Paste your product page URL into Ad Studio — it reads your product images and details automatically. Then choose the template your analysis points to. Hook rate was low on UGC ads? Stay in the UGC template but plan a new opening. Polished ads underperforming on TikTok? Switch to a creator-style or review template that matches the platform's native feel. Your analysis decides the template, not guesswork.
Step 2 — Customize the hook, avatar, script, and format. This is where the fix happens. Set a new hook based on what the data told you, swap the avatar, edit the AI-drafted script line by line, and pick the background. Need five new hooks? Generate five variants with different opening treatments in the same session. Need a platform-specific format? Every export comes sized to spec — Stories, Reels, Feed, TikTok — so the 9:16 vertical version is ready without manual resizing.
Step 3 — Generate variants at volume and repeat the play. A single session can produce 20–50 variants across hooks, avatars, formats, and product angles. Once you've found the combination that fixes the problem, the play is repeatable: hook rate drops again, run a fresh batch of hook variants on the same product URL. A format keeps underperforming on a specific platform, regenerate in the template and aspect ratio that platform rewards. Same inputs, new variants, every cycle.
Separate refreshes from net-new creative. A refresh changes one element — hook, avatar, or script — while keeping the proven template and structure intact. Net-new creative tests a completely different concept. Do not do both at the same time. Refreshes take a single Ad Studio session. Net-new creative requires a new angle, a new template, and a new testing cycle.
Recommended read: What Is the Best Place for Scalable Ad Creative in 2026?
Final Verdict
Creative analysis is not a one-time audit. It is a continuous cycle: measure, diagnose, act, regenerate, repeat. The faster your cycle runs, the faster you learn. The faster you learn, the better every campaign that follows performs.
Start with one campaign. Apply the 3-stage framework. Find where it is losing people. Fix that one thing. That is ad creative analysis in practice.
Frequently Asked Questions
Ad creative analysis is the process of evaluating whether a specific ad's hook, visual, copy, and format are doing their job. Unlike campaign reporting — which tells you how budget is being spent — creative analysis tells you why performance looks the way it does and which creative element is responsible.
Use a 3-stage framework. For attention: hook rate, thumb-stop rate, and CPM. For engagement: hold rate, average watch time, and engagement rate. For action: CTR, CPA, and ROAS. Analysing all three stages tells you exactly where in the viewer journey a creative is winning or losing.
Five signals indicate a creative has stopped working: CTR drops 20% below the 7-day baseline, CPA rises 15–20% above the 30-day median, frequency crosses 3.0 to 4.0, conversion rate drops while CTR holds, or negative sentiment appears in the comments section. Act on these signals before performance fully collapses.
Refresh a creative when early fatigue signals are present but CPA is still acceptable, or when one element like the hook or headline is wearing out while the core concept is still strong. Retire a creative when CPA exceeds your target by 75% or more, or when you have already refreshed it once and performance continues to decline.
Syed Anas Hussain
Syed Anas Hussain is a computer scientist blending technical knowledge with marketing expertise and a growing passion for AI innovation. Curious by nature, he dives into new AI sciences and emerging trends to produce thoughtful, research-led content. At ImagineArt, he helps audiences make sense of AI and unlock its value through clear, practical storytelling.