
Syed Anas Hussain
June 15, 2026 • Updated June 15, 2026
11 mins Read
I've watched marketers obsess over hook rate for three months straight — run 40 creative variations, bring the number from 18% to 37% — and then look at their ROAS and wonder why nothing changed. Hook rate and hold rate are measuring two completely different moments in the same video. Treating them as the same problem is the most efficient way to spend a lot of time fixing something that wasn't broken.
What Hook Rate Measures (The Short Version)
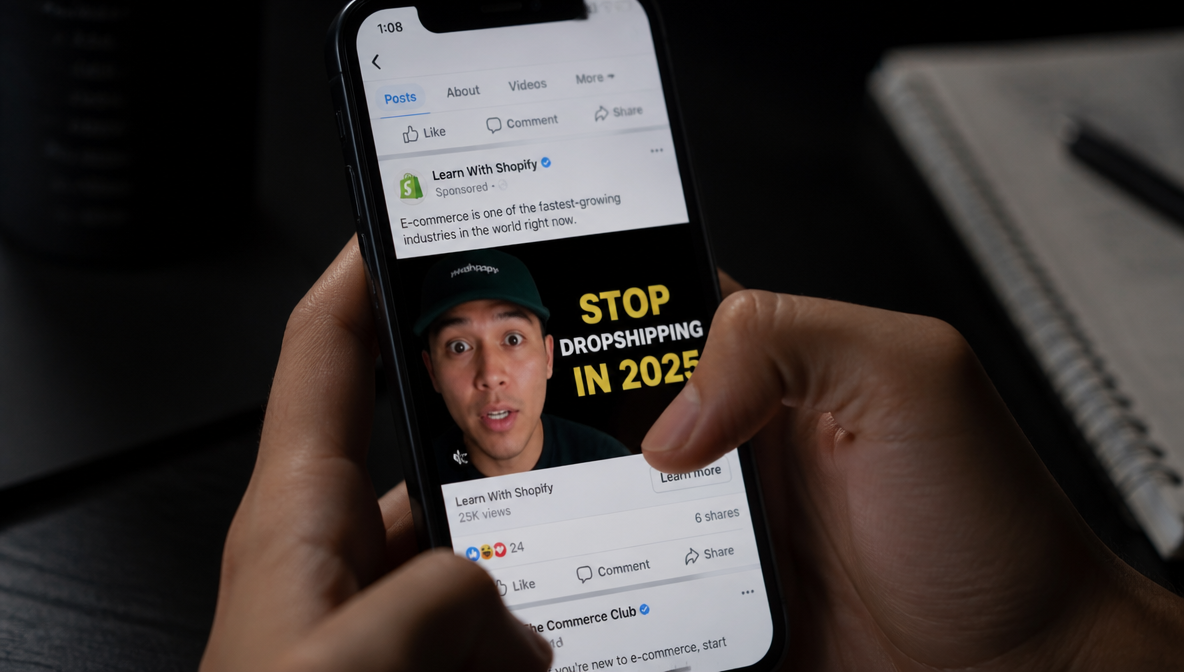
Hook rate is the percentage of people who watch at least the first three seconds of your video ad after it appears in their feed.
Formula: (3-second video views ÷ impressions) × 100
It measures one thing: did the first frame stop the scroll?
I've covered this in full in What Is Hook Rate? — benchmarks, the formula, why a low hook rate is a volume problem and not a creativity problem. The condensed version for this article: 28%+ is solid on Meta in 2026, 40%+ puts you in the top tier. Below 20%, the opening is failing before anything else can matter.
The critical limitation of hook rate: it tells you nothing about what happens after second three.
What Hold Rate Measures (The Part Everyone Skips)
Hold rate is the percentage of your video that viewers watch on average. Two ways platforms report this:
Video completion rate (VCR): The percentage of viewers who watched the entire video. Most useful for short-form under 15 seconds.
Average watch percentage: The average portion of the total video length that viewers watched. More useful for anything over 15 seconds.
The hold rate formula:
(Total watch time ÷ (video length in seconds × total views)) × 100
A 30-second ad. 10,000 views. 150,000 total seconds watched:
150,000 ÷ (30 × 10,000) = 0.50 = 50% hold rate
Half the video watched on average. People are leaving around second 15. That's a starting point, not a verdict.
Hold rate benchmarks in 2026:
| Platform & Length | Below Average | Solid | Strong | Elite |
|---|---|---|---|---|
| Meta (under 15s) | Under 35% | 35–50% | 50–70% | 70%+ |
| Meta (15–30s) | Under 25% | 25–40% | 40–60% | 60%+ |
| TikTok (under 30s) | Under 40% | 40–55% | 55–75% | 75%+ |
| YouTube (skippable) | Under 20% | 20–35% | 35–55% | 55%+ |
One benchmark note most articles skip: shorter videos have higher hold rates by default. Always read hold rate relative to video length before drawing conclusions.
The 4 Combinations — What Each One Actually Diagnoses
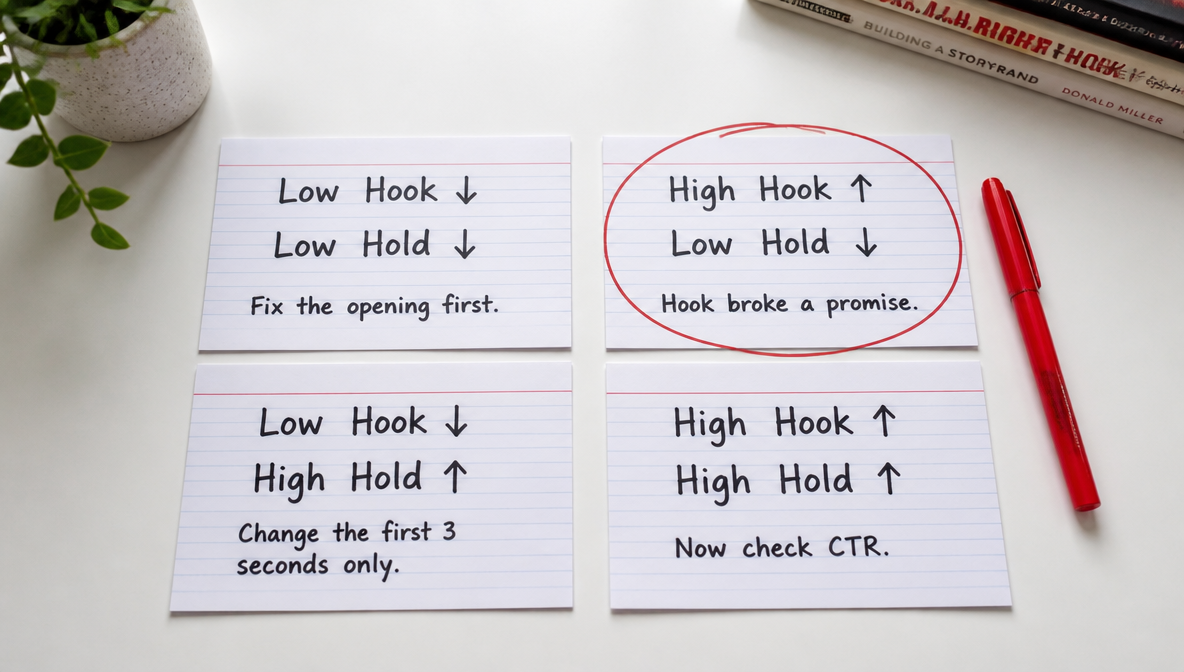
Combination 1: Low Hook Rate + Low Hold Rate
Almost nobody stops, and the few who do leave quickly. Fix hook rate first — you can't get meaningful hold rate data without enough viewers creating a readable retention curve.
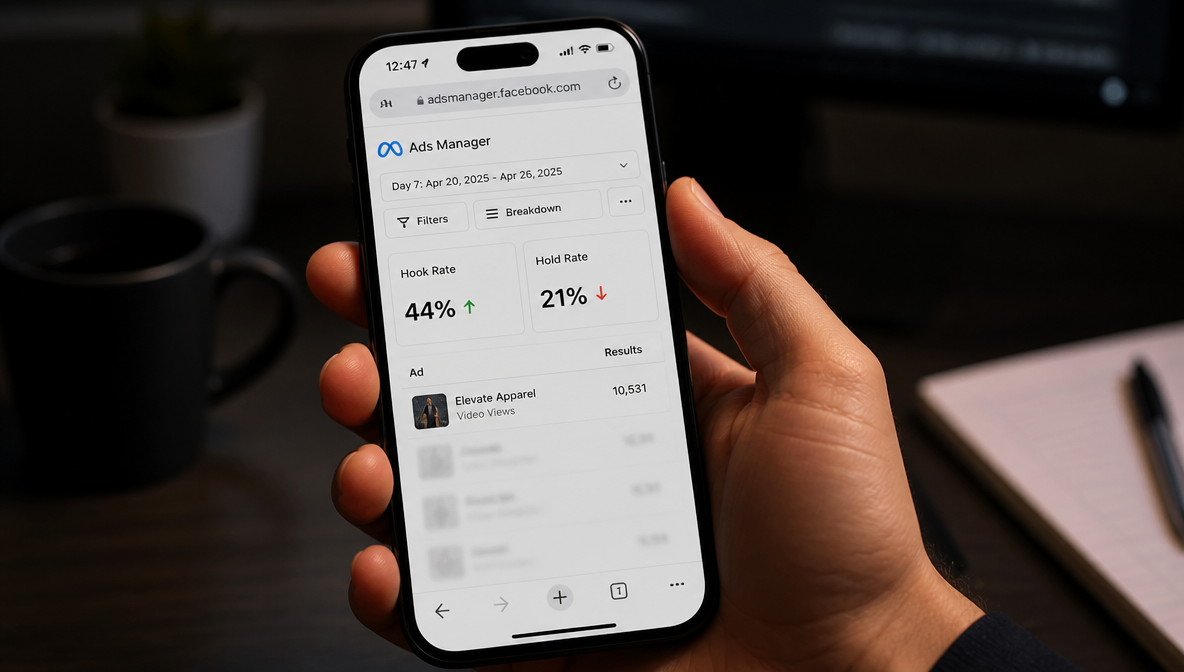
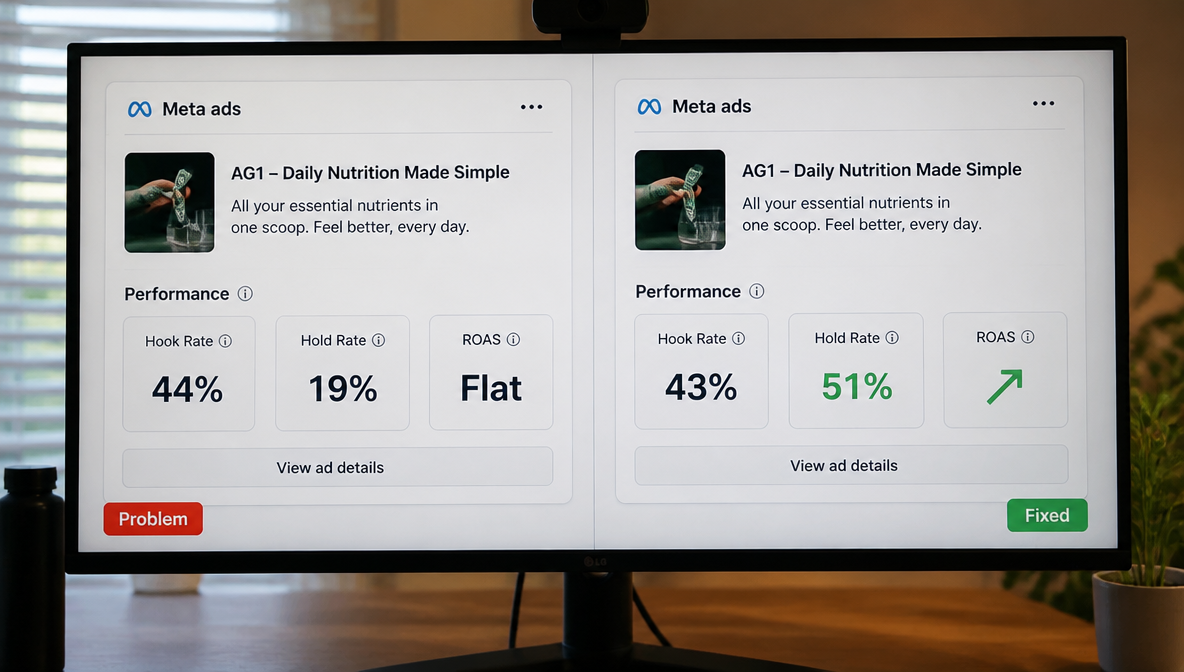
Combination 2: High Hook Rate + Low Hold Rate
The sneaky bad combination. The hook is working. The ad isn't. High hook rate creates a false signal of success while hold rate quietly tells you the content isn't keeping the promise the opening made.
I've had campaigns with 44% hook rates and mediocre conversion. The opening was a pattern interrupt — visually surprising, completely disconnected from the product. People stopped, took stock of what they were watching, and left within five seconds. The hook was technically performing. The money was being wasted.
What to fix: the transition from hook to body. The first 3 seconds and the next 5–7 seconds need to be the same conversation.
Combination 3: Low Hook Rate + High Hold Rate
Almost nobody stops. The people who do watch most of the video. The content is working. The opening isn't. One hook refresh — without touching anything else — can move this to a winner.
The other common cause: ad fatigue. The same creative running long enough that the hook rate decays because audiences have seen the opening enough times that the scroll reflex fires before they consciously process it. Hold rate stays high. Hook rate drops. The fix is a fresh hook, not a rebuilt ad.
Combination 4: High Hook Rate + High Hold Rate
Both metrics are working. Now look at CTR and conversion rate. If those are also strong, scale. If CTR is weak despite strong hook and hold, the CTA or landing page is the bottleneck.
This is the combination that thorough ad creative analysis tries to find at scale — the ads with this profile, what they have in common, how to replicate them intentionally.
How to Boost Hook Rate
Hook rate is a function of the first frame and the first three seconds. Every lever for improving it lives in that window.
Lead with motion, not setup. Static opening frames lose to motion in the first frame consistently. If your ad opens on a logo, a product packshot, or a talking head with no movement, test a version that opens mid-action.
Put the most compelling element first. Whatever is most surprising, most specific, or most emotionally resonant about your ad — move it to second one. The setup can come after the stop.
Make the first frame work muted. More than 70% of social video is watched without sound. If your hook only works with audio, test a version with bold text-on-screen in the first three seconds that carries the same message visually.
Replace vague with specific. "Dramatically improved our results" is scrolled past. "CPL from $34 to $8.70 in 11 days" stops the scroll. Specificity creates credibility faster than any visual treatment.
Test a direct address hook. Name the exact person you're talking to in the first line. Hook rate may be lower than a broad-appeal opener — but the viewers who do stop are higher intent, and hold rate tends to follow.
Shorten the creative. Shorter ads have higher hook rates by default because the platform's three-second view threshold represents a larger percentage of the total video. If you're testing hook improvement, a 15-second version of a 30-second ad will mechanically produce a better hook rate signal.
How to Boost Hold Rate
Hold rate is broken at a specific second. The job is to find that second and fix what's there — not rebuild the entire creative.
Pull the retention curve first. The three platforms above all provide this data. Find the exact second where the steepest drop-off happens. That's your fix target, not a general creative overhaul.
Fix the hook-to-body transition. The most common hold rate killer is a hook that earns the stop but doesn't connect to what follows. The first 3–7 seconds need to feel like the same conversation — same tone, same subject, same promise being developed rather than abandoned.
Cut dead zones ruthlessly. Mid-video cliffs are almost always caused by a moment that doesn't earn its place: a transition, a product explanation before the viewer is invested, or a pacing change that breaks rhythm. Find the second, cut the moment.
Deliver value earlier. If the payoff — the result, the product reveal, the proof — is arriving in the last five seconds, move it earlier. Front-loading the best content increases the probability of holding viewers through a CTA they might otherwise skip.
Shorten the video. The fastest way to raise hold rate mechanically is to cut the video length. A 15-second ad with a 55% hold rate often outperforms a 30-second ad with a 35% hold rate in downstream conversion, because viewers who watch 55% of 15 seconds have watched more of the actual selling content than viewers who watch 35% of 30 seconds.
Match the CTA to the emotional temperature. Pre-CTA drops happen when the offer feels mismatched to the tone of everything that came before it. A high-energy direct response CTA on a contemplative emotional ad kills hold rate in the final seconds. Calibrate the pitch to the register you've built.
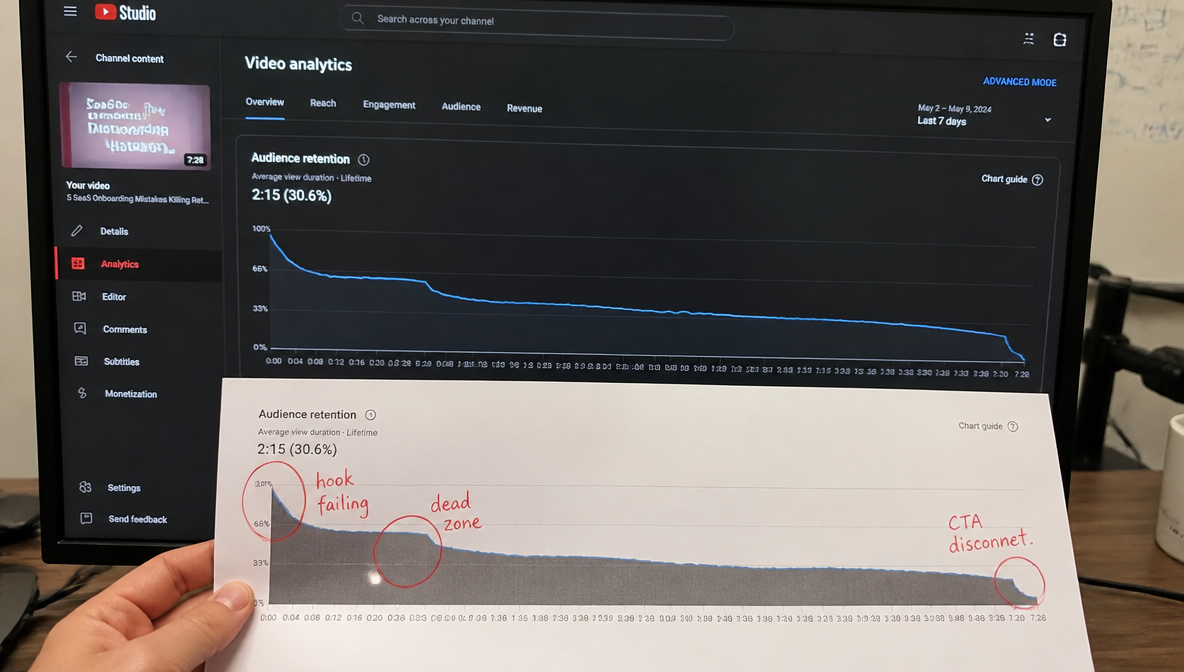
Reading the Retention Curve
A single hold rate number tells you the average. The retention curve — the graph showing what percentage of viewers are still watching at each second — tells you exactly where the ad breaks down. Meta, TikTok, and YouTube all provide this. Use it every time.
Where to find the retention graph on each platform:
- Meta Ads Manager: Go to Ads Manager → select your ad → click into the ad-level reporting → open the Breakdown menu and select Video →
You'll find the Video Average Play Time and Video Plays at 25%, 50%, 75%, 100% metrics. For the full second-by-second curve, go to the Creative Hub or use the Video Engagement Audience chart inside Meta Business Suite under Insights. The retention curve is most readable when you select a single ad creative in isolation rather than an ad set aggregate.
- TikTok Ads Manager: Navigate to Reporting → select your campaign → click into the ad → switch to the Video tab.
TikTok shows video play actions at 25%, 50%, 75%, and 100% thresholds. The full audience retention curve is available inside TikTok Creative Center under Top Ads when analysing individual creatives — for your own ads, the percentage-play breakdown in Ads Manager is your primary signal.
- YouTube (Google Ads): Go to Google Ads → Campaigns → Videos → click into the individual video ad → select the Audience Retention tab.
YouTube provides the most granular retention curve of the three platforms — a second-by-second graph showing exactly where viewers drop off. This is the clearest diagnostic tool for identifying the specific moment in your ad where engagement breaks.
Front-loaded drop (seconds 0–5): Branding or logo in the first 5 seconds, name introduction, product packshot before context. Fix: push branding to 7–10 seconds, lead with the problem or result.
Mid-video cliff (seconds 8–15): Dead zone in the structure. A transition that doesn't earn its place, product explanation arriving before the viewer is invested. Fix: identify the specific second where the cliff starts and cut what's there.
Pre-CTA drop (last 5 seconds): The creative works until the pitch. The offer lands as too aggressive or disconnected from the tone of what came before. Fix: calibrate the CTA to the emotional temperature of the ad.
Testing Volume Makes Both Metrics Readable
The honest limitation of this framework: it requires enough data. A single creative with 6,000 impressions doesn't give you a retention curve worth acting on. You need volume and variation.
Testing multiple creatives simultaneously — different hooks, different structures, different bodies — gives you comparative data that's actually diagnostic. AI Ad Studio removes the production barrier to running that volume. Five creative variations in an afternoon, not five briefs and five edit cycles. Once you have the variations running, the creative testing methodology for reading the results properly is worth having sorted before launch.
What to Prioritise When Both Metrics Are Off
- Get hook rate above 20% before doing anything else. Below that, you don't have a hold rate problem — you have a visibility problem.
- Once hook rate is solid (28%+), pull the retention curve. Find the cliff. Fix the specific moment.
- When hook and hold are both solid, check CTR and CPA. Those tell you if the conversion mechanism is the bottleneck.
- Repeat. The winning creative becomes the benchmark. The question is always what the next tests need to beat.
FAQs
Hook rate measures the percentage of viewers who watch past the first 3 seconds of your video ad — it tells you whether the opening stopped the scroll. Hold rate measures the average percentage of the full video that viewers watch — it tells you whether the content kept them engaged after the opening. Hook rate is about the first moment. Hold rate is about everything after.
For Meta ads under 15 seconds, solid hold rate is 35–50% with 50–70% being strong. For 15–30 second ads, solid is 25–40% and strong is 40–60%. TikTok hold rates run higher — 40–55% is solid for ads under 30 seconds. Always read hold rate relative to video length: shorter videos naturally achieve higher hold rates.
Divide total watch time (in seconds) by total video length multiplied by total views, then multiply by 100. Example: a 30-second video with 10,000 views and 150,000 seconds of total watch time = 150,000 ÷ (30 × 10,000) = 50% hold rate.
Yes — high hook rate with low hold rate means the opening made a promise the content didn't keep. The hook rate looks like a success signal while the ad is quietly losing people within the first 8 seconds. Always check both metrics together, never in isolation.
Hook rate first. You can't get meaningful hold rate data without enough viewers creating a readable retention curve. Once hook rate is above 28%, shift focus to the retention curve to find specific drop-off points. After both are solid, check CTR and conversion rate.
It tells you the opening made a promise the content didn't keep. The first 3 seconds created an expectation — curiosity, entertainment, relevance — and the content that followed didn't deliver. Fix the transition between the hook and the first 5–7 seconds of the body.
Ad fatigue typically kills hook rate before hold rate. As audiences see the same creative repeatedly, hook rate drops because the scroll reflex fires before conscious processing. Hold rate stays relatively stable because the content is still resonant for viewers who do stop. Declining hook rate with stable hold rate is the diagnostic signal for fatigue: refresh the hook without rebuilding the creative.
Syed Anas Hussain
Syed Anas Hussain is a computer scientist blending technical knowledge with marketing expertise and a growing passion for AI innovation. Curious by nature, he dives into new AI sciences and emerging trends to produce thoughtful, research-led content. At ImagineArt, he helps audiences make sense of AI and unlock its value through clear, practical storytelling.