AI infographic generator
Paste in a data file, a bullet list, or a short brief and this ai infographic generator returns a fully designed infographic back in under a minute. Built for marketers, teachers, and analysts who need a clear visual without hiring a designer.



You might also be interested in
Infographic Community Creations
What the AI infographic generator actually does
You give it raw material: a CSV of numbers, a paragraph explaining a process, or a list of five facts, and it decides how to visualize that content. That means picking a chart type for numeric data, an icon set for a step-by-step process, or a comparison layout for two options, then arranging headline, supporting text, and visual elements into one designed page. You are not assembling shapes on a canvas by hand, which is the whole point of using an infographic maker ai instead of a blank template. When a piece needs a custom illustration or hero image rather than a chart, the AI image generator creates that visual from a text description.
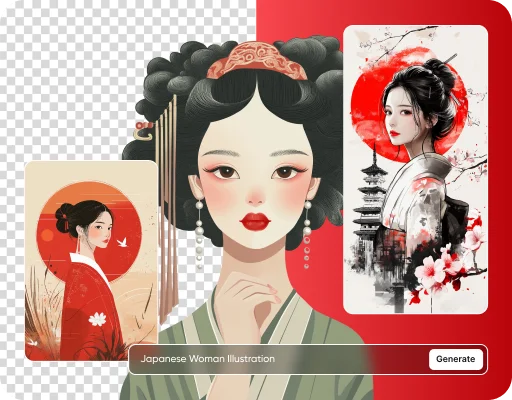
How to create an infographic without starting from a blank canvas
The traditional path is opening a design tool, picking a template close to what you need, then manually placing every chart, icon, and text block. Here, you start by writing or pasting the content you want shown, in plain sentences or a data file. The generator produces a full first layout from that content, which you then adjust rather than build from an empty page.
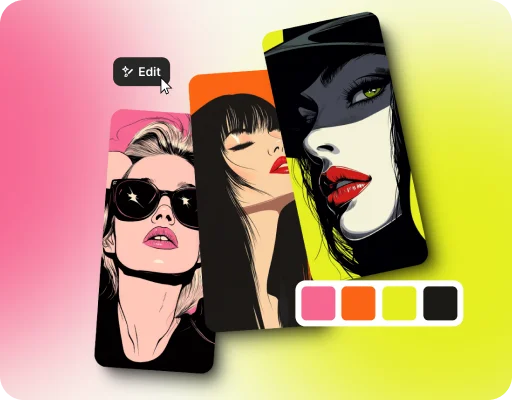
Turning a spreadsheet into something people actually read
A spreadsheet with twelve rows of quarterly numbers means nothing to someone skimming a slide for four seconds. Feed the same numbers in and the generator picks an appropriate chart type, bar, line, or proportion, and labels each value directly on the visual. The result is built to be read in a glance, which is the entire reason infographic tools exist instead of a table. For text-heavy data like survey responses or keyword lists, the word cloud generator turns that into a visual the same way.
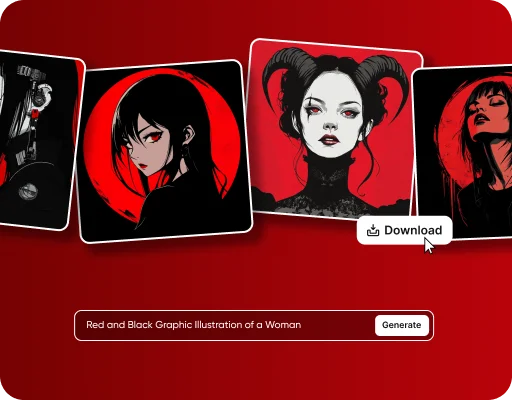
Fonts and colors that match without manual adjustment
Upload a brand color hex code or reference logo once and every infographic generated afterward pulls from that palette automatically. A marketing team producing one infographic a week for a newsletter no longer needs someone checking each new file against the brand guide before it ships. The colors and type pairing carry over on their own from the first setup, so this infographic ai keeps every new piece on-brand without a manual check. The same brand setup carries across the other design tools on ImagineArt AI.
How It Infographic Generator Works?
Step 1
Add your content or data
Paste in raw numbers from a spreadsheet, a short written brief, or a bullet list of facts you want shown. Mention the format you're picturing, like a timeline, a comparison, or a top-five ranking, if you already have one in mind. A rough draft of the content is enough to start.
Step 2
Generate the infographic
The system chooses a layout suited to your content type, whether that's a chart for numeric data or an icon sequence for a process, then arranges headline, data labels, and supporting text into a finished design. Regenerate for a different layout style or a different chart type without re-entering the data.
Step 3
Download and export
Export at the aspect ratio you need: square for a social post, vertical for a Pinterest-style share, or a wide format for a presentation slide. As an infographic creator, it exports files as high-resolution PNG or as an editable layered file for further adjustment in another design tool.
Where teams put infographics to work
- Marketing newsletters:A text to infographic ai pass turns a weekly stat roundup or product update into one shareable visual.
- Sales decks:A comparison infographic showing a product against a competitor's offering, built for one slide, sitting on a matched backdrop from the AI presentation background generator.
- Classroom materials:A process or timeline infographic that explains a concept faster than a paragraph of text.
- Social reports:A quarterly numbers recap posted as a single image instead of a thread of individual stats.
- nternal reporting:A one-page visual summary of a metric review for a team that doesn't read the full spreadsheet.
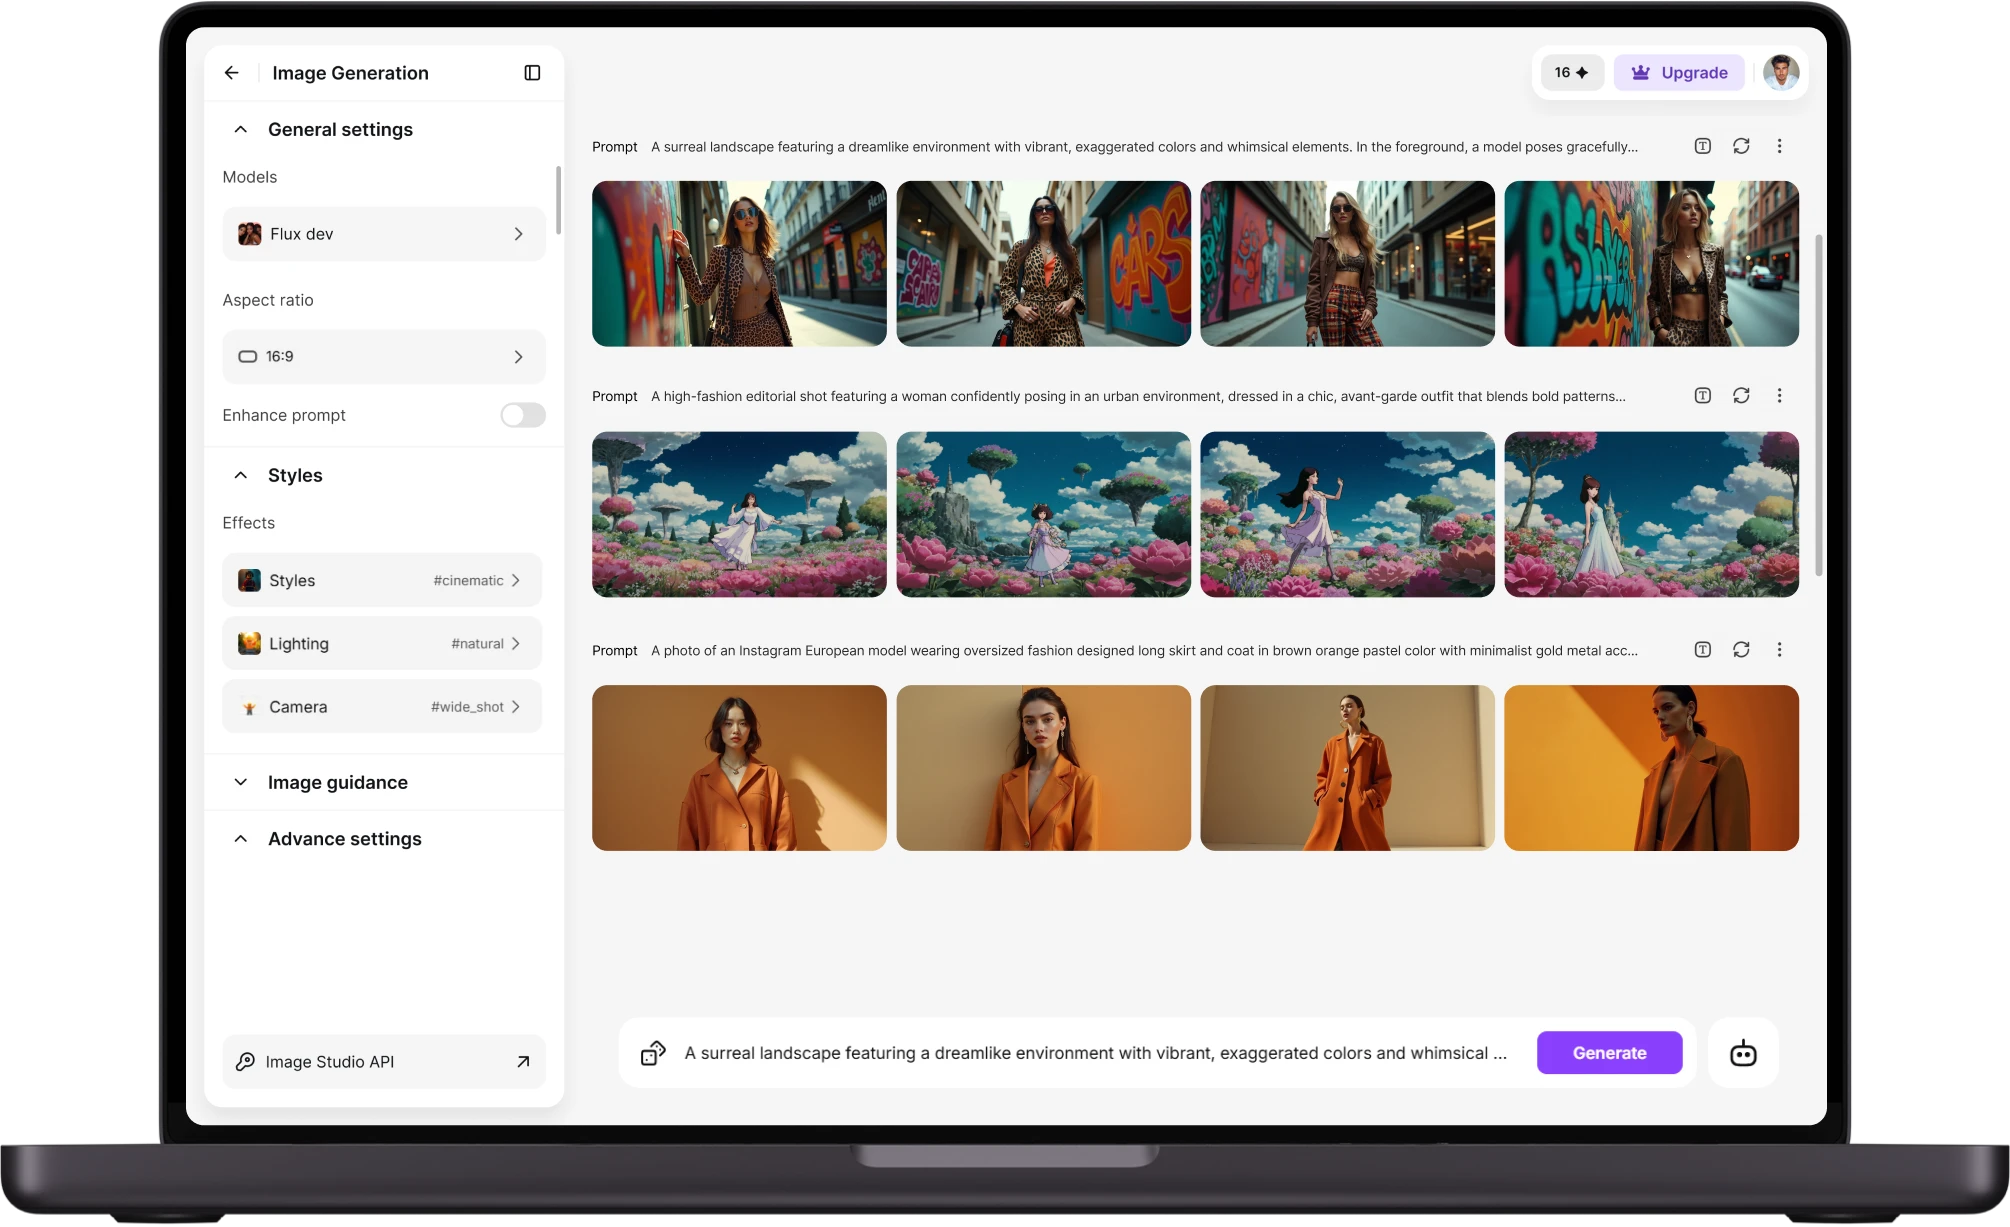
Export options built for wherever the infographic goes next
- Aspect ratio presets:Square, vertical, and widescreen formats cover a social post, a Pinterest pin, and a slide deck from one design.
- High-resolution PNG:Export at print or presentation quality without pixelation on zoomed-in data labels.
- Layered file export:Download an editable version for further tweaks in another design tool if a team member needs to adjust it later.
- Brand color matching:Set a hex code once and every infographic generated afterward applies that palette automatically.
- Font pairing carry-over:Brand fonts set at setup apply to every new infographic without reselecting them each time.
Customer Testimonials About AI Infographic Generator
Learn what users say about Imagine ai art generatorImagine ai art generator

“I love this platform very easy to navigate through whatever you need to create. Excellent image generation and video generation. The pricing is very reasonable also. Thank you Imagineart for an amazing experience.”
“Imagine art is one of the best platforms for new AI creators offering the best prices, the market leader like Higgsfield are great but their prices are too high. Thank you imagine art for making AI Video models affordable.”
“ImagineArt is a powerful creative suite, but if you want to leverage its flagship photorealistic and cinematic models, you’ll need to invest in a top‑tier account. For casual creators, the free/basic tier is sufficient, but professionals aiming for commercial‑grade visuals will find the upgrade essential.”
“ImagineArt is an amazing AI art platform with an intuitive interface, fast image generation, and impressive results. It offers a great variety of styles and tools, making it easy to bring creative ideas to life. Whether you're a beginner or a professional, it's a reliable and enjoyable tool for creating high-quality artwork. Highly recommended!”
“ImagineArt has a really amazing interface, well layered and clean. The workflow feature really makes working easy with all tools available in one place. One other thing, when I tested models like for instance Nano Banana 2 on ImagineArtAi and other Ai brands I got better results and higher quality on ImagineArtAi. It goes to show how much they have invested in making it the best of the best”
Purchase a Subscription
Upgrade to get access to pro features and generate more and better
Basic
For newcomers taking their first steps
View Plans
Billed monthly
Included in plan
3Kcredits per month
Additional Features
Up to ~600 Image Generations/month
Up to ~97 Video Generations/month
General Commercial Terms
Image Generation Visibility: Public
4 Concurrent Image Generations
Complimentary Access
All GPT Models
All Gemini Models
All Claude Models
Unlimited Generations
10 Image Models
9 Video Models
Standard
For rising creators to level up their game
View Plans
Billed monthly
Included in plan
8Kcredits per month
Additional Features
Up to ~1.6k Image Generations/month
Up to ~265 Video Generations/month
General Commercial Terms
Image Generation Visibility: Private
8 Concurrent Image Generations
Complimentary Access
All GPT Models
All Gemini Models
All Claude Models
Unlimited Generations
Nano Banana
Runway Gen 4 Turbo
Midjourney V7
8 more Image Models
8 more Video Models
Ultimate
Peak performance for pros
View Plans
Billed monthly
Included in plan
16Kcredits per month
Additional Features
Up to ~3.2k Image Generations/month
Up to ~530 Video Generations/month
All styles and models
General Commercial Terms
Image Generation Visibility: Private
Complimentary Access
All GPT Models
All Gemini Models
All Claude Models
Unlimited Generations
All image models in Standard plan
All video models in Standard plan
Kling 2.6 Pro
Seedance 1.5 Pro
ChatGPT 1.5
Creator
A full production engine for powerhouses
View Plans
Billed monthly
Included in plan
100Kcredits per month
Additional Features
Up to ~20k Image Generations/month
Up to ~3.3k Video Generations/month
All styles and models
General Commercial Terms
Image Generation Visibility: Private
Complimentary Access
All GPT Models
All Gemini Models
All Claude Models
Unlimited Generations
All image models in Ultimate plan
All video models in Ultimate plan
Kling 3.0 Pro
Seedance 2 Fast
Nano Banana 2
Have questions?
We have answers!
It is a tool that turns raw content, whether that's a spreadsheet of numbers, a written brief, or a list of facts, into a fully designed infographic. It selects an appropriate visual format such as a chart, a comparison layout, or a timeline based on the content you provide, then arranges headline, data labels, and supporting text automatically. It's built for marketers, teachers, and analysts who need a clear visual without a design background.
Start by gathering the content you want shown: a data file, a short written summary, or a list of key points. Paste or upload that content into the generator, mention the format you're picturing if you have one, and generate a first layout. From there, adjust colors, swap a chart type, or edit text directly, rather than building the entire design from a blank canvas.
Yes. Upload a CSV or spreadsheet directly and the generator reads the values, chooses an appropriate chart type based on what the data represents, such as a comparison, a trend, or a ranking, and labels the visual with your actual numbers. This removes the manual step of building a chart in one tool and then redesigning it around that chart in another.
Exports include square and vertical formats for social posts and pins, and a widescreen format suited for a presentation slide. Files export as high-resolution PNG for immediate use, or as a layered file if a team member needs to make further edits in another design tool. All formats generate from the same underlying design, so no rebuilding is required between them.
Yes. Set a brand's color hex codes and font pairing once during setup and every infographic generated afterward applies that palette and type choice automatically. This is commonly used by teams producing recurring content, like a weekly newsletter graphic, so each new piece matches the brand without a manual check before publishing.
Turn your next data set into one clear image
Paste in your numbers or your brief and get a finished infographic back before your next meeting starts, no cost to try this free ai infographic generator on your first data set. One data set in, one shareable visual out.